
Performance Monitor
Windows 8
 |
To access, follow these steps
-
Open Administrative Tools
-
Click Performance Monitor

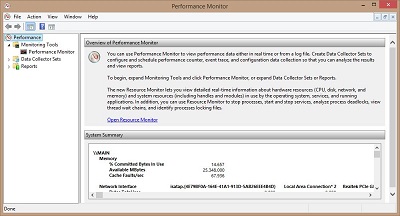
You can use Performance Monitor to view performance data either in real time or from a log file. Create Data Collector Sets to configure and schedule performance counter, event trace, and configuration data collection so that you can analyze the results and view reports.
To begin, expand Monitoring Tools and click Performance Monitor, or expand Data Collector Sets or Reports.
The new Resource Monitor lets you view detailed real-time information about hardware resources (CPU, disk, network, and memory) and system resources (including handles and modules) in use by the operating system, services, and running applications. In addition, you can use Resource Monitor to stop processes, start and stop services, analyze process deadlocks, view thread wait chains, and identify processes locking files.
-
Monitoring Tools
-
Performance Monitor
-
-
Data Collector Sets
-
User Defined
-
System
-
System Diagnostics
-
NT Kernel
-
Operating System
-
Processor
-
System Services
-
Logical Disk Dirty Test
-
Smart Disk Check
-
AntiSpywareProduct
-
FirewallProcduct
-
AntiVirusProduct
-
UAC Settings
-
Windows Update Settings
-
Performance Counter
-
BIOS
-
Controller Classes
-
Cooling ClassesInput Classes
-
Memory Classes
-
Motherboard Classes
-
Power Classes
-
Printing Classes
-
Storage Classes
-
Video Classes
-
NTFS performance
-
Interactive Session Processes
-
Processes
-
Logged On Users
-
User Accounts
-
Startup Programs
-
Desktop Rating
-
Startup Settings
-
Disk Settings
-
-
System performance
-
NT Kernel
-
Performance Counter
-
-
-
Event Trace Sessions
-
Circular Kernel Context Logger
-
AITEventLog
-
Audio
-
DiagLog
-
EvenLog-Application
-
EventLog-Application
-
EventLog-Microsoft-Windows-WorkFolders-WHC
-
EventLog-System
-
FamilySafetyAOT
-
LwtNetLog
-
NtfsLog
-
SQMLogger
-
UBPM
-
WdiContextLog
-
RAC_PS
-
MpWppTracing-11212014-084254-00000003-ffffffff
-
HomeGroupLog
-
IDListenLog
-
NegoLog
-
Pku2uLog
-
-
Startup Event Trace Sessions
-
AITEventLog
-
Audio
-
Circular kernel Context Logger
-
DiagLog
-
EventLog-Application
-
EventLog-Microsoft-Windows-WorkFolders-WHC
-
EventLog-Security
-
EventLog-System
-
FamilySafetyAOT
-
LwtNetLog
-
Microsoft-Windows-Setup
-
NBSMBLOGGER
-
NtfsLog
-
PeauthLog
-
RAC_PS
-
RdrLog
-
ReadyBoot
-
RefSWmLog
-
SetupPlatform
-
SQMLogger
-
TCPIPLOGGER
-
Tpm
-
UBPM
-
WdiContextLog
-
WFP-IPsec Trace
-
-
-
Reports
-
UserDefined
-
System
-